Wednesday, May 18, 2011

Plankton Diversity Lab


Introduction: Plankton are living organisms that cannot swim against a current. The word "plankton" means "wanderer" in Greek. There are four ways to classify plankton. Classified by their food, there are two types of plankton. Phytoplankton get their nutrients through photosynthesis. Zooplankton are heterotrophic. Plankton are also classified by color. There are green, red, brown, golden, & blue-green plankton. Plankton are categorized by their lifestyles. Holoplankton live their entire lives as plankton, such as algae & jelly fish. Meroplankton live only part of their lives as plankton, such as barnacles and turtles. Lastly, plankton are classified by size. Including some examples, Megaplankton are over 2 milometers in size. Microplankton are between 0.06 & 0.2 milometers. Ultraplankton are less than 0.005 milometers.

Question: How diverse are the plankton species of South Maui?

Hypothesis and Prediction: I think that around 20 plankton species will be found in our samples, because Hawaii's warm & clean waters could probably support that seemingly diverse amount. If there are less that around 20 species found, then the environment we collected our sample from probably can't support a high plankton population.

Materials: plankton net, line, microscope, collection jars, journal, pipette, cover slip, & ID books


Procedure:


  1. Go to a location where it is safe and convenient to test the water and use the plankton net (in this case, Kihei Boat Ramp).


  2. Observe the wind, weather, wave action, and tide. Record your observations.


  3. Test the water to determine the different variables for the plankton's living conditions and record the results for each:


  • Find the water's temperature and pH level. Remove cap from pH/temperature pen. Place pen in water to be sampled. Wait for numbers to stabilize.


  • Use a refractometer to find the salinity of the water. Lift the cover and use a pipette to put a few drops of water onto the prism. Close the lid, then look through the eye piece. Record the parts per thousand of salinity displayed on the scale to the right.


  • Use the dissolved oxygen test to find the level of dissolved oxygen in the water. Fill the test vile up to the 10 ml mark with water. Insert a dissolved oxygen tablet into the test vile. Cap and start to shake before the tablet has dissolved fully. Shake for one minute. Then, let sample sit for 5 minutes. Compare the color of your sample to the chart given.


  • Finding the nitrate and phosphate levels is very similar to finding the disolved oxygen levels. Fill test vial with water to 10ml. Add test tablet and shake for one minute. Let the sample sit still for 5 minutes. Compare the sample color to the color on the chart given.


  • Find the turbidity using the secchi disk and test vile. Fill test vial to 25ml. Place test vial over the secchi disk on the card. Compare it to the the pictures of the other disks.


4. Use the plankton net to collect samples:


a) Remove cap on sample vile.


b) Slowly lower the net into the water.


c) Drag net through the water until a reasonable amount of organic matter is captured (usually about 3-5 minutes).


d) Quickly pull net out of water and let drain.


e) Cap sample vial & remove from net.


5. Use a microscope to observe the plankton you collected:


a) Remove the microscope cover and plug into an outlet.


b) Using the pipette, fill the three sample slide with water taken from the collection jar.


c) Add one or two drops of detain to each of the 3 samples on the slide.


d) Lay the slide underneath the lower microscope lens.


e) Look through the upper lens and focus it using the adjustable ring around it.


f) Draw some different species of species you observe and label them to the best of your ability using the ID books.


g) When finished, carefully pour the samples in the slide back into the collection jar.


h) Rinse the slide in the sink and dry.


i) Unplug the microscope and cover it.


6. Use a Proscope to observe the plankton you collected:


a)Plug the Proscope into the computer and open up its program.


b) Slowly and carefully pour some water from the collection jar into a petree dish. Take the pipette and extract some water from the very bottom of the collection jar and add it to the water in the petree dish.


c) Put the petree dish directly under the round lens on the Proscope.


d) Slide a white piece of paper under the petree dish.


e) Focus and lens by moving it up or down manually until the picture is clear. If needed, add about 10 drops of detain.


f) Draw some different species of species you observe and label them to the best of your ability using the ID books.


g) Take pictures and video, then save them to your z-drive.


h) When finished using the Proscope, raise the lens and wipe it dry. Unplug it from the computer and put it back into it's case.


i) Slowly and carefully empty the petree dish into the collection jar.


j) Rinse the petree dish and dry.


Data:


Wind) calm


Weather) sunny, partly cloudy


Wave action) subtle


Temperature) 25.2C


pH) 8.1


Tide) low


Salinity) 21 ppt


Dissolved Oxygen) 2


Nitrates) 1


Phosphates) 1


Turbidity) 0 JTU


I was able to possatively identify four plankton species.


Conclusion: My question was, "How diverse are the plankton species of south Maui?" My hypothesis was, "I think that around 20 plankton species will be found in our samples, because Hawaii's warm & clean waters could probably support that seemingly diverse amount." According to the data I collection, my hypothesis was incorrect, because I only identified about 1/5 of the amount I thought I would find. I beleive there were errors to alter my results. I was only about to identify a few, but there were actually many more species in my samples. The samples that we took at first when we tested the water and took observations weren't the same as the samples that we observed in class. Different conditions may have altered the results. When trying to identify plankton, it was hard to tell which pictures were the most similar to the plankton I was observing. This may have been because of the quality of the image I saw using the Proscope.

Monday, May 2, 2011


Introduction:

My class took a trip to the beach next to the NOAA Pacific Whale Sanctuary in Kihei. We split up into 3 groups to create a beach profile.There are a few different factors affecting the natural beach profile. One factor is armoring. There is a fish pond on the south end of the beach. This increases erosion, resulting in a narrowed beach. Another factor affecting the beach profile is dune destruction. The sand dunes on this beach were probably flattened to allow for residents across the street to have better ocean views. Even though the dunes are being rebuilt, the beach has already been damaged. Total healing will take a long time. The beach could also be affected by a drainage ditch perpendicular to the beach. Inland sediments are most likely transported to the shore during flodding or heavy rain.
Procedure:
1. In order to find the slope of the beach, we used a transect line, rise tool, run tool, compass, and a GPS device.
2. Run the transect line from the top of the assigned location to the water line (perpendicular).
3. Use the GPS to mark the point at the beginning and end of the transect line.
4. Use the rise and run tool to calculate the slope of the beach.
a) Place the rise tool at the beginning of the transect line with the level on the top. Position the rise tool so that the bubble in the level is centered.b) Place the run tool one meter away on the transect line. (The end of the horizontal meter stick should touch the rise tool.) Make sure the bubble on the balance indicator is centered.c) Record the height difference in centimeters.
d) Follow steps a-c for every meter until you get to the foot of the beach.
e) Record the results on the beach profiling data sheet.
5. While using the transect line as a reference, use the compass to make sure you are measuring in a constant direction.


This map displays the route of a guave thrown into the water to find the direction of the current.


The above picture shows one of my group members using the run tool. Another group member is using a compass.


In this picture, my group is using the rise and run tools with a compass to find the slope of the beach.


Friday, April 15, 2011

Sand Origins Lab

Introduction: There are two main origins of sand. One origin is biogenic, meaning it comes from something living. The other is detrital, meaning it is something that comes from non-living sources. You can test the sand to find it's origin by adding vinegar and observing the sample. Calcium carbonate (CaCO3) is the biogenic material in sand. The calcium carbonate has a chemical reaction with the vinegar (CH3COOH) creating, in part, carbon dioxide (CO2) making the sand snap crackle and pop! The formula is CH3COOH+CaCO3---->Ca(CH3COOH)2+H2O+CO2. The amount that the sand reacts to the vinegar shows how much or if the sand has biogenic material.


Question: Is the sand at the Cove and Kam II mainly biogenic, or detrital?


Hypothesis: I think that the sand at the Cove will be mainly biogenic because of its light color, fine texture, and coral pieces. I think Kam II is mainly detrital because there is no shielding and the sand is a moderately dark tan color. If my hypothesis is incorrect about the Cove, it most likely has more detrital shielding than can be seen from the shore. If my hypothesis is incorrect about Kam II, the beach may have biogenic shielding that cannot be seen from the shore.


Materials:


  • Paper/Journal


  • Pencil


  • Permanent marker


  • Pipette


  • Vinegar


  • Small beakers


  • Containers to take sand samples


  • Tape to label containers (optional)


  • Sand Samples


  • Safety goggles

Procedure:


  1. Take samples of sand you would like to test. Make sure you label them with the date and beach name.


  2. When at the beaches you are taking samples from, jot down some observations of the beach structure and sand.


  3. To test the sand, poor a thin layer of sand into a small beaker. (enough to cover the bottom)


  4. Use the pipette to drip vinegar into the sample. Don't soak it; only add 20 drops dispersed over the surface of the sand.


  5. Observe and record the reaction that the vinegar has with the sand. (CH3COOH+CaCO3---->Ca(CH3COOH)2+H2O+CO2)


  6. Repeat steps 3-5 for every sample you test.


Data:


Field Observations:


The Cove: Like colored colar pieces and rocks, tan colored and fine grain sand, Lava rock shielding surronding beach.


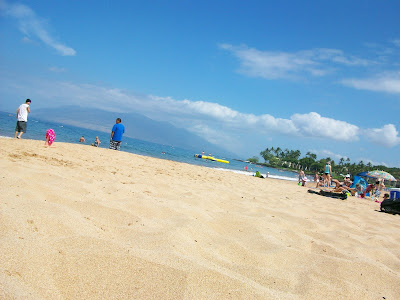
The Cove looks similar to the beach shown here.


Kam II: No shielding, lava orcks to the south, and tan colored sand.


Kam II looks similar to the beach shown above.


Waipulani: Biogini shielding, coran, algea, medium grain sand, and light tan colored sand.


Sugar Beach: Armor, no other shielding, dark tan sand, and medium grain.


Data Analysis:


Conclusion:


In this lab experiement, the goal was to determine whether the sand samples from The Cove and Kamaole II were biogenic or detrital. In my hypothesis, I thought that the sand at The Cove would be mainly biogenic because of its light color, fine texture, and coral pieces. This part of my hypothesis was correct. I also thought that Kamaole II was going to be detrital because of no shielding and the sand's moderatelty dark sand color. This part of my hypothesis was incorrect. It was found out that both beaches were biogenic. Both sand samples (containg calcium carbonate) from beach had noticable reaction (bubbles and cracking sounds) with vinegar (acetic acid).


A possible source of error in this experiment could be that the bacteria in the samples could have triggered the reaction and therefore affected the result. Another error could be from vinegar which was diluted with water (not a pure vinegar).

Monday, March 28, 2011

Humpback Whale Observation Lab continued...

This graph displays my lab results. The results showed that there were more whales in the beginning of the season than the end. Conclusion: (Look back to the last blog entry for the question, hypothesis, and earlier lab information.) The data I was able to collect told me that I either had too many sources of error to get accurate results or that my hypothesis was incorrect. There turned out to be less calves spotted the second time, but only by one count. Possible Sources of Error:

  • There were times when we could not see the whales we spotted well enough to know their actions or the type of pod.

  • Since some of the pod types were unclear, there could have been more calves that were not counted.

  • Collecting the two sets of data at different times might have effected the results because the whales may have a certain “schedule”.
My Experience on the Whale Watch: The whale watch I went on for my second data collection was great. I hadn't been on a boat in a long time before that. We spent the first half hour of the watch collecting data, because that's about how long our first data collection was. I collected the data and my partner took pictures. After that, we had the rest of the time to enjoy the boat. There was nice sunny weather with some clouds, lots of whales, and a snack bar. I'm very glad I brought my sunglasses along. I would have had a harder time looking for whales without them. I was disappointed that I didn't see any turtles (I usually do), but one of the whales coming close up to the boat made up for it. This may have been the last school outing I will have before my high school graduation. I'm glad it turned out really good. :)

Sunday, January 30, 2011

Humpback Whale Observation Lab

Purpose of Our Whale Observation: To analyze one of the multiple variables associated with the observation of Maui’s humpback whale populations.

My Research Question: How many more humpback calves were spotted earlier in the season than later?

Hypothesis: I predict that we will find more humpback calves later in the season because more will be born.

My Experience with the First Whale Observation: The whale observation at McGregor's Point on Maui went alright for me. What I liked most was finding out about the location for the first time. It has an outstanding view of the ocean. There were a few challenges that I came across. I should have been prepared with a hat or sunglasses for the sunny sky. It was difficult to see much without squinting harshly or shading my eyes with my hand. It was also difficult to spot the number of whales and the pod type from so far away without binoculars. It was also very challenging to estimate the whales' direction of travel. During the first half of our time there, we were able to spot quite a few whales. We couldn't see any during about the second half of our time frame there. I was satisfied with being able to at least see some whales on this trip.

Procedure:
1) Gather all of your materials and go to a place on Maui with a wide, clear view of the ocean (in this case, McGregor's Point).
2) Look out for any signs of whales.
3) When you find one or more whales, record the time and date of the observation on your data sheet.
4) Using your binoculars (if you have a pair), observe the number of whales, pod type, behaviors, and direction of travel. Be sure to record this information on the data sheet.
5) Use your clinometer to find the distance of the whale(s) and record this on your data sheet.
How to use a clinometer:
  1. Look through the tube at the top of the tool so that you can see the whale(s).
  2. Hold the hanging string in place against the protractor in the exact position it's in when you look through the tube.
  3. Record the number (the one less than 90) on a scratch sheet of paper. This is the angle of inclination of your view of the target.
  4. Find your elevation using a GPS and also record that on the scratch sheet of paper.
  5. Plug these two pieces of information into the equation Distance = Elevation x tan(angle of inclination).
  6. Solve this equation using a scientific calculator. On your calculator in this order, punch in the angle of inclination, tan, x (multiply), then the elevation.
  7. This number is the approximate distance from you to the whale(s) (in whichever unit of measurement you found your elevation).
6) Repeat steps 2-5 for every whale or pod you spot. Be sure not to record the same whales more than once.

Wednesday, January 5, 2011

Marine Phyla Lab

My class has was studying 9 marine phyla. Porifera are sponges. Cnidarians are jellyfish, sea anemones, and corals. Platyhelminthes are flat worms. Nematoda are round worms. Molluska are organisms like snails, slugs, squid, and octopi. Annelids are segmented worms. Arthropoda are insects, arachnids, and crustaceans. Echinoderms are sea stars, brittle stars, and sea urchins. Chordata are fish. We counted how many of each we could find in the Waipulani tide pools in Kihei, Hawaii. We used ID books to identify the organisms.

The research question was Which marine Phyla are present at the Waipulani tide pools of South Maui, and which Phyla are most represented in diversity and quantity? In my hypothesis, I thought we would find Cnidarians, Molluska, Arthropoda, Echinoderms, and Chordata, because my class found them in the tide pools during the first visit. We did not find any Cnidarians or Echinoderms. We did find Molluska, Arthropoda, and Chordata. I also thought that the Arthropoda would be most diverse based on the different kinds of crustaceans found earlier. Molluska turned out to be the most diverse. I inferred there would be the greatest number of Molluska, because the most organisms we saw on the first trip were Pipipi or something very similar. This guess was correct.
There are many possible sources of error that could have altered our results
in this data collection. Individual pieces of data could have been counted more than once. The transect line could have been laid in a biased place. The person counting could have scared some organisms away by accident. Organisms could have been hidden where the person looking could not see them. The tide could have been too high or low to show the normal amount and types of organisms. The identification of organisms could have been faulty. Some of these errors could be and were prevented, others could not
I thought this lab was pretty fun and interesting. I think I would have liked it a lot better if
we found more of a variety of organisms. What I liked that most was learning about marine phylum using a hands on experience rather than just using classroom methods. This is Advanced Science Research Methods.
I learned some new techniques wh
en sketching a map of the research area that were helpful. I have a better understanding of the 9 phyla.